
The dollar's comeback crushes risk appetite
Bitcoin traded as low as $58,000 on Thursday, June 25, according to Seeking Alpha. The price decline coincides with the US Dollar Index (DXY) climbing to 101 — a level last seen in May 2025. A stronger dollar has historically been one of the most powerful headwinds for cryptocurrency.
The correlation between Bitcoin and the DXY has tightened to -0.83 over the past three months, according to available market data. By comparison, the corresponding correlation stood at -0.34 for the year to date. This means that during this period, Bitcoin has been moving in the opposite direction of the dollar to a greater degree than usual.
The mechanism is well understood: higher interest rates strengthen the dollar, draw capital toward safe-haven assets such as government bonds, and raise the opportunity cost of holding volatile assets like crypto.

Fed outlook weighs on the market
A key driver behind dollar strength is expectations surrounding US monetary policy. Bank of America Global Research has recently shifted to a more hawkish stance, now forecasting three rate hikes of 25 basis points each — in September, October, and December 2026. Should this materialize, it would tighten financial conditions further and increase pressure on risk-heavy assets.
Additionally, an inflation picture that remains too warm for the Federal Reserve to consider cutting rates — combined with an economy holding up more strongly than many had anticipated — is pushing expectations of monetary easing further out on the horizon.
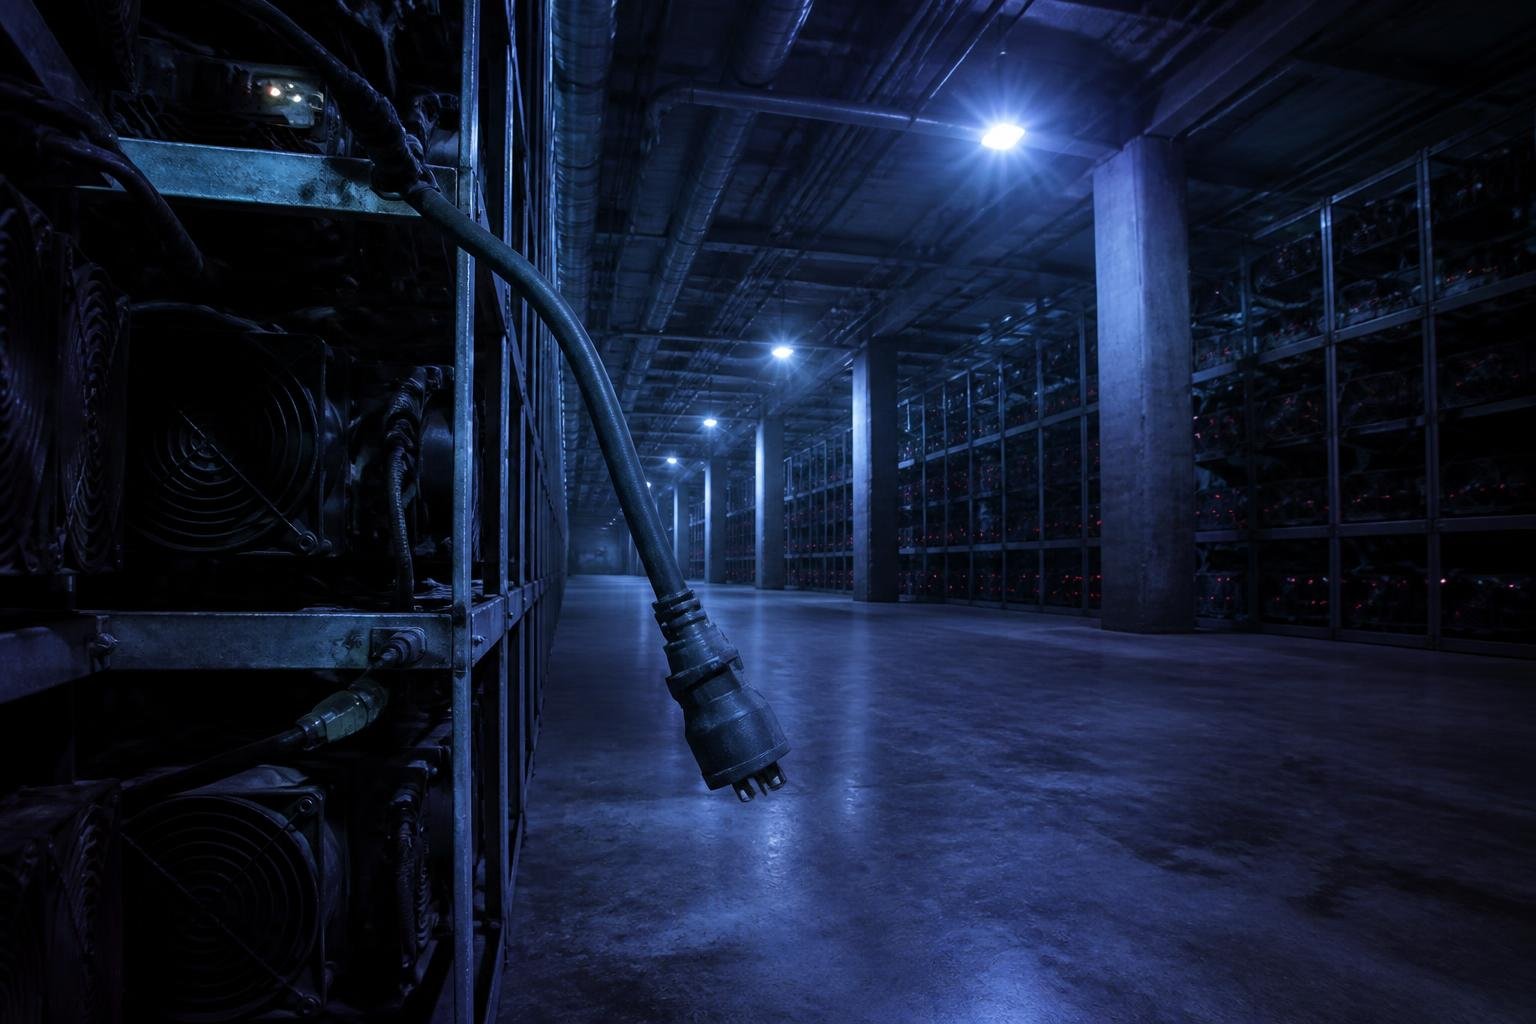
Miner indicators signal serious pressure
Alongside the price decline, the situation for Bitcoin miners is deteriorating rapidly. Several key indicators are now flashing red.
The Puell Multiple — a measure of daily mining revenue in dollars relative to its one-year average — stood as low as 0.57 on June 10, according to available on-chain data. That places it just above what has historically been defined as the "buy zone" at 0.5, a level last observed during the bear market of 2022.
JPMorgan analysts noted as early as June 21 that Bitcoin's price was well below the bank's estimated production cost of around $78,000. The gap between market price and production cost has now persisted for five months — the longest stretch in this cycle. Approximately 20 percent of all miners are estimated to be operating at a loss.
Mining difficulty drops sharply
Bitcoin's network difficulty — the automatic adjustment mechanism that regulates how demanding it is to mine new blocks — has fallen more than 20 percent from its record high, according to Galaxy Research. This marks the largest decline since 2021. In the second week of June, a single downward adjustment of 10 percent was recorded.
The next adjustment window is estimated for June 27, where an increase from 124.93 to 133.14 terahash is expected — a sign that some capacity may be returning to the network.
Exchange inflows from miner platforms to Binance exceeded 150,000 BTC in June, the highest level in over four months. This is interpreted as miners liquidating their holdings to cover ongoing operating costs.
Are we at the bottom — or not?
Some analysts believe the situation may represent a classic buy signal. The Hash Ribbons indicator, developed by Charles Edwards, is designed precisely to capture such periods of miner capitulation. Edwards has previously stated that the moment miners give up can represent one of the strongest buy signals the Bitcoin market offers.
Others are more cautious. Analyst Joao Wedson believes the market has not yet experienced an "extreme" capitulation comparable to previous cycles, pointing to the absence of large losses and significant supply shifts in on-chain data. Glassnode has also noted that the kind of intense capitulation activity that has historically triggered lasting bottom rallies has not yet been observed — in part because demand in the market remains too weak.
For now, it is the macro picture — a strong dollar, delayed rate cuts, and an inflation outlook that refuses to cool — that is setting the terms.
This article was written using large language models under editorial supervision by Aprex. Content is source-verified and auditable. Read our method →