
What's driving the movement
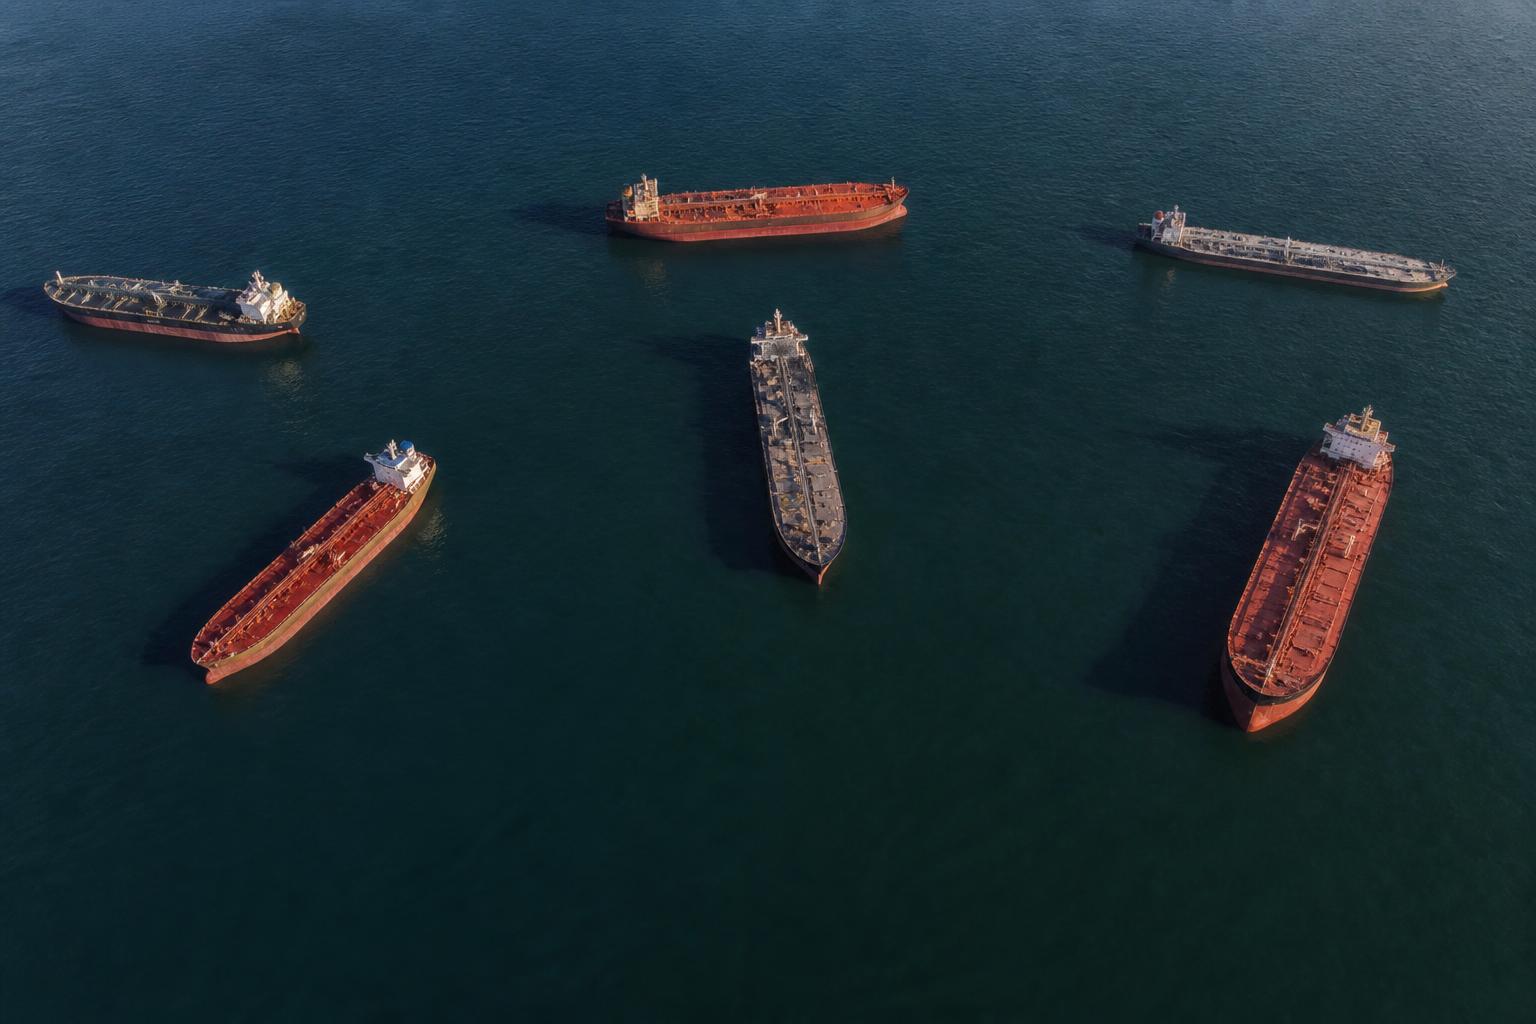
The launch of "Project Freedom" by US Central Command marks the first coordinated military-escorted passage through the Strait of Hormuz since Iran crippled commercial shipping traffic in late February. Tanker traffic through the strait collapsed by over 80% after Iran declared it closed, and Lloyd's Joint War Committee immediately extended its "high-risk" classification to cover the entire Arabian Sea (Lloyd's, March 2026).
The main question now is not whether ships can pass — they apparently can, with military escort. The question is whether the insurance market will normalize quickly enough for commercial shipping to resume scale. According to David Smith at McGill and Partners, rates are moving "almost hour by hour" and are still between 3.5% and 10% of vessel value — far above what is profitable for most operators without government subsidy.
For a $100 million tanker, this means a single-voyage insurance cost of up to $10 million — far exceeding typical freight costs. A Suezmax tanker in March 2026 reportedly paid $7.5 million in Additional War Risk Premium (AWRP) for one transit, which exceeded the ship's $6.5 million freight revenue to the destination (Oilprice/research, May 2026).
The US DFC (International Development Finance Corporation) announced a $20 billion reinsurance program with rolling capacity of $40 billion for hull, cargo, and liability — an attempt to force the insurance market back to functionality. The effect is still limited, but it is the structural condition for "Project Freedom" to have commercial impact beyond symbolic politics.
Broad market implications
The S&P 500 is under pressure in a general risk-off climate, and the DXY remains stable — typical for geopolitical uncertainty that does not yet have a clear directional vector. Gold is a natural winner in this type of regime. Bitcoin at $80,246 shows no clear upside response to geopolitical unrest, underscoring that the "digital gold" narrative is still weak in practical crisis pricing.
"The insurance market has a proven mechanism that responds effectively to such crises — but no one can insure a ship that doesn't exist" — Marcus Baker, Global Head of Marine, Marsh (March 2026)

Key figures
Winners and losers
Losers
Shipping operators with US/UK/Israel ties ("missile magnets" in market jargon) are hit hardest. They pay premium peaks of 7.5–10%+ of vessel value, and many have simply remained at anchor since late February. The volume loss in the strait of 80%+ affects companies like Frontline, Euronav, and DHT Holdings, which are heavily exposed to Gulf routes.
Asian importers — especially China, Japan, and South Korea — now pay significantly higher effective oil prices after freight costs and insurance are added to the spot price. Alternative routes around the Cape of Good Hope add 10–14 days to travel time and increase bunker fuel costs accordingly.
Winners
The insurance market itself — Lloyd's syndicates and P&I clubs that have been able to offer coverage under new terms are collecting exceptionally high premiums. Lloyd's CEO Patrick Tiernan confirmed premium levels of around 5% of vessel value — "approximately five times the levels from the early days of the war" (Lloyd's, March 2026).
Alternative energy exporters — Norwegian gas via the North Sea, US LNG via Atlantic routes, and Russian oil via non-Hormuz channels (to the extent it is traded) receive structurally better pricing in a market with reduced Gulf supply.
Oil futures and energy hedging desks — volatility and backwardation in the Brent curve provide opportunities for active players. Front-month Brent near $100 versus longer maturities reflects acute supply uncertainty.
Technical picture
Brent crude oil
Brent holds support around $95–97/barrel after repeatedly testing the $100 level. RSI on the daily chart is in overbought territory (~68–72), but in geopolitical supply crises, this can be sustained longer than technical models suggest. MACD still shows positive momentum, but divergence is starting to build on the 4-hour chart.
Key levels:
- Resistance: $103–105 (psychological and technical level from 2023 peaks)
- Support: $94–96 (volume node from March 2026 bottom area)
- Breakdown level: A break below $90 would signal that the market is pricing in that "Project Freedom" is actually opening the strait commercially
Shipping insurance premiums (indicator)
Neither publicly traded nor a traditional technical analysis tool, but the premium trend is the market's most precise "fear gauge" for Hormuz risk:
- Pre-crisis (before Feb 28): 0.10–0.25% of vessel value
- Peak March 2026: 10%+
- Current: 1–3% (down from peak, but 8× pre-crisis levels per McGill and Partners)
A normalization down towards 0.5–0.75% would be the clearest signal that the market is starting to price in a real, lasting opening of the strait.
What to watch for
Upcoming catalysts:
"Project Freedom" is a political victory for the Trump administration — but until the insurance market normalizes, it is a symbolic opening of a channel that commercially remains de facto closed.
This article was written using large language models under editorial supervision by Aprex. Content is source-verified and auditable. Read our method →