TL;DR
A rare signal flashes red
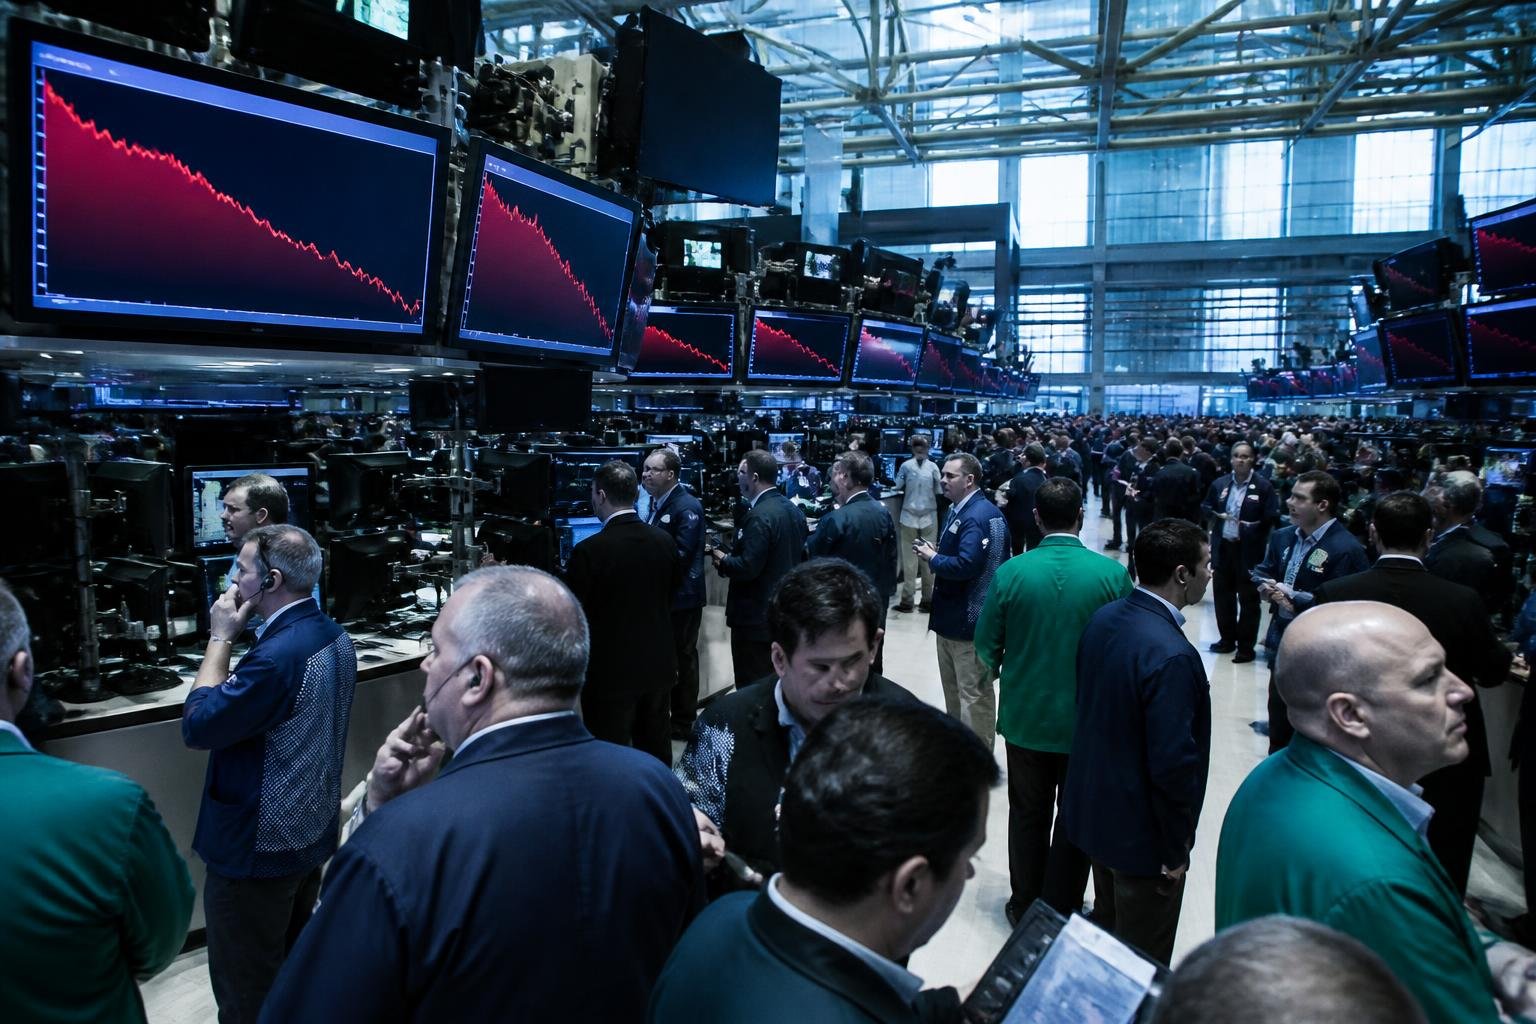
According to Yahoo Finance, the S&P 500 has triggered a technical signal that has barely been observed since the dot-com bubble burst more than two decades ago. Details in the source material are limited, but the signal coincides with a broad risk picture in which market sentiment has reached an extreme level — the Fear & Greed Index currently stands at just 11 out of 100, placing us deep inside "extreme fear" territory.
It has been a long time since US equity markets have sent out warnings of this kind. For investors who remember 2000–2002, the signal carries an uncomfortable sense of familiarity.

What does history tell us about periods like this?
The dot-com bubble marked the end of a decade of extremely high valuations, particularly in the technology sector. When the bubble burst, the S&P 500 lost nearly half its value over the course of two and a half years. The similarities with today's situation — and any distance from it — are something analysts are now actively debating.
It is important to stress that a single technical signal alone is not a prediction of a crash. Such indicators have a long track record of false alarms, and markets can remain irrational for extended periods. The source (Yahoo Finance) presents the scenario as a warning, not as a foregone conclusion.

Crypto: Neither a safe haven nor free from risk
Some investors consider crypto an alternative when traditional equities fall. Research shows, however, that the picture is far more complex.
Before 2020, the correlation between Bitcoin and the S&P 500 was almost zero — Bitcoin moved independently of the stock market. After the corona crash in March 2020, this changed dramatically. In early March 2026, the 30-day rolling correlation stood at 0.74, with intraday readings as high as 0.94, according to available market data.
In practice, this means that during periods of market stress, Bitcoin falls simultaneously with equities — and often harder. In 2022, the S&P 500 fell 19 percent, while Bitcoin plunged 65 percent over the same period.
Signs of decoupling in May 2026
Something interesting did occur in May 2026, however: the crypto market, including Bitcoin and Ethereum, moved in the opposite direction to US equities. The S&P 500 rose for nine consecutive weeks, while crypto values fell. This decoupling is an exception to the dominant trend of recent years, but it demonstrates that the correlation is not absolute.
CoinGecko researchers also noted that the correlation between Bitcoin and the S&P 500 fell to near zero in the third quarter of 2025, even though other digital assets still showed a moderately high dependence of 0.68.
What does this mean for Norwegian investors?
For Norwegian investors, the picture is mixed. The Oslo Stock Exchange (OSEBX) is heavily weighted toward energy and seafood, which provides a degree of natural buffer against pure tech exposure. However, a broad downturn in US equities would typically spill over into European and Norwegian markets.
The most important lesson from the research is that diversification via crypto does not provide the protection many expect — at least not consistently. Stablecoins such as DAI have shown low correlation with traditional markets in some studies, but this is a highly specialised and risky area.
The rare signal in the S&P 500 is not a guarantee of a crash. But it is a reminder that valuations and market dynamics have historical parallels — and that history sometimes repeats itself.
This article was written using large language models under editorial supervision by Aprex. Content is source-verified and auditable. Read our method →