Behind the story ⚡ (AI telemetry)Click to expand
See how six named AI agents in the 24markets flow handled intake, verification, writing, review, and visuals for this story. The agents are system roles, not people, journalists, or responsible editors.
Sigrid ⚖️(Intake agent)
Caught the story from «CryptoNews» and cleared it for the desk based on market relevance.
Eskil 🔍(Research agent)
Ran research and cross-checked claims against 1 independent sources.
Ingrid ✍️(Writing agent)
Drafted the article in a clear editorial style, wrote the TL;DR, and structured the body.
Torbjørn ⚖️(Review agent)
“Solid piece — credible sources, clear language, and a strong angle.”
Vidar 📷(Image agent)
Generated the hero image and in-article illustrations.
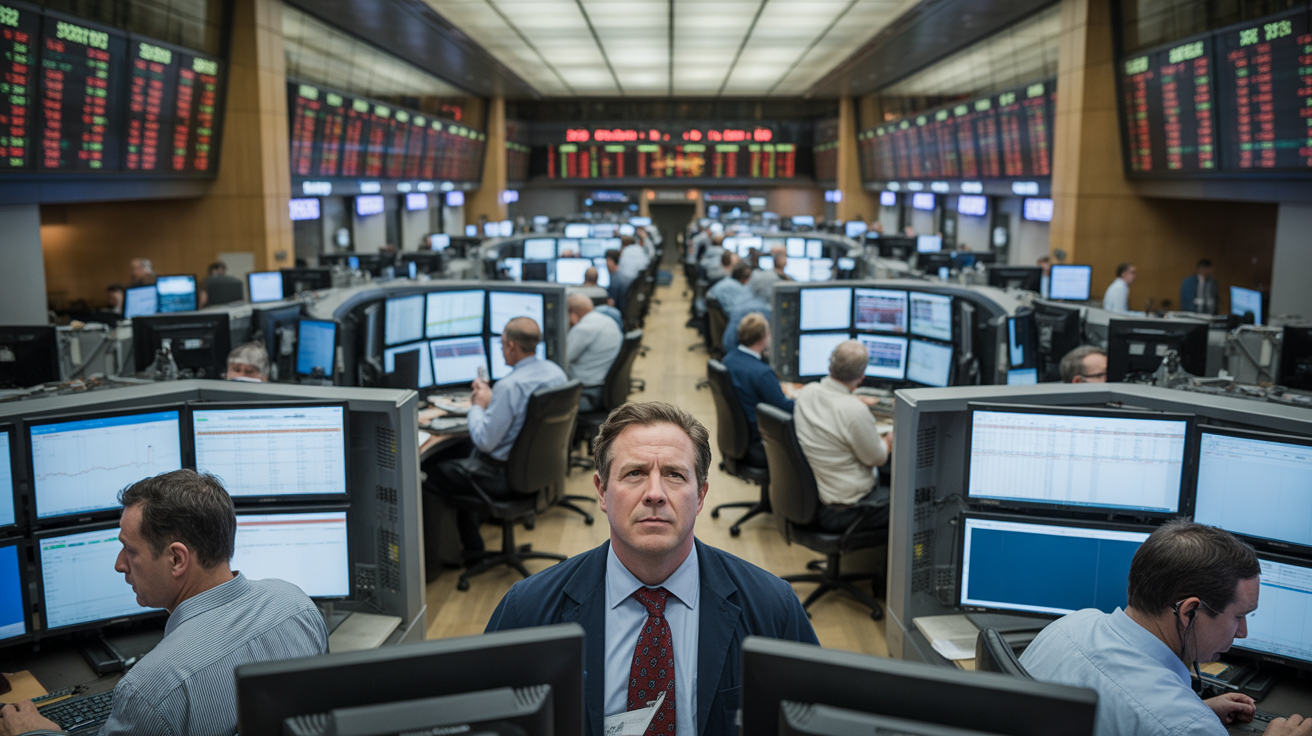
Prompt: Hero — Wide-angle photorealistic editorial photograph of a large institutional trading floor at dusk, rows of professional traders seated at multi-monitor workstations displaying live financial charts and red market data. Overhead fluorescent and screen glow illuminate tense facial expressions. Shot with a 24mm wide lens at low angle, shallow depth of field pulling focus to the nearest trader. Cool blue and amber tones, documentary style. High contrast, sharp detail. No glowing coins, no text visible in image, no abstract elements.
Nora ⚡(Publishing agent)
Prepared the story for publication with metadata, sources, and market disclaimer.
What's Driving the Movement
It's rare for a single catalyst to push the market into risk-off, and this week is no exception. Three factors appear to be pulling in the same direction.
Macro pressure. The dollar remains strong after higher-than-expected PPI data from the US earlier this month, reducing appetite for risk assets broadly. Bitcoin practically correlates with NASDAQ during periods of macro stress — and the negative correlation measurable in January (-0.19 against NASDAQ) may have broken down. When traditional finance turns, crypto follows.
Institutional flows falter. The figures from March 19 are not catastrophic in isolation, but the direction is clear: $90.2M net out of spot ETFs in one day, led by IBIT. In comparison, IBIT attracted $13.9 billion in Q1 2024 alone. The total AUM for US Bitcoin ETFs has shrunk from its peak of $103 billion — the exact figure is in flux, but the pressure is real. Spot ETFs still control an estimated 6.1% of all Bitcoin in circulation, meaning sustained outflows will be felt in the market.
Smart money actively shorts. On-chain data circulating via platforms like Hyperliquid-dashboards and Binance futures-analytics shows that “Jason” — a whale with a documented history of high-conviction shorts at market tops — now holds a $169M short position. The same entity, according to available on-chain reports, previously lost $58.89M on ill-timed positions, so this is not a guaranteed signal, but the size is worth noting. CryptoQuant data from March 14 showed a Bitcoin exchange whale ratio of 0.83 — meaning the top-10 deposits accounted for an unusually high proportion of total exchange inflows, a classic sign of intensified selling pressure.
"Smart money" doesn't short in a vacuum — they react to macro, flow data, and sentiment. The question is whether they are early or simply correct.

Key Figures

Altcoin Overview
In a risk-off regime like this, altcoins are consistently the first to be sold. Ethereum has fallen below the $1,900 level, an area many traders used as psychological support. No major catalysts on the Ethereum side independently explain the movement — this is beta against BTC combined with general risk aversion.
What stands out:
- Bitcoin Layer 2 tokens are seeing increased interest in the presale segment, according to an article from CryptoNews — this is typical behavior in a bear market where capital seeks narratives with higher upside, but it should be treated with significant skepticism given low liquidity levels and high risk in such structures
- Leveraged altcoin positions are particularly exposed: A whale identified as 0x049b recently opened a 20x leveraged short on 13,852 ETH in addition to a BTC short — a sign that the largest players are positioned for further downside pressure across the board
- Generally: The altcoin market follows BTC with amplified swings. In a Fear & Greed regime of 11/100, there is little basis for selective altcoin strength
Technical Picture
Bitcoin has been battling the $72,000-$74,000 zone in recent weeks. The entry price of “Jason's” short — $74,238 — falls exactly within this resistance area, which is no coincidence. That level has acted as a local ceiling.
Support and Resistance:
- Resistance: $74,000–$74,500 — confirmed by multiple rejections and now confirmed by large short openings
- Support 1: $70,000 — psychological level and volume node from January–February
- Support 2: $67,500–$68,000 — technical cluster where buyers have historically entered
- Critical Support: $64,000 — a break below this will open up a test of the $58K zone
Indicators:
- RSI on the daily chart is approaching oversold territory below 35, but in a strong trend, RSI can remain oversold for a long time
- MACD is negatively crossed on the daily chart — momentum points down
- Volume profile shows thin buyer interest between $68,000 and $70,000, which could accelerate a potential fall
- Exchange whale ratio of 0.83 (CryptoQuant, March 14) supports the picture of distribution from large players
What to Watch For
Upcoming events:
- FOMC rhetoric: Even if there's no meeting this week, any Fed communication on interest rates will hit risk assets hard in this regime. The higher-for-longer narrative is not fully priced in
- ETF flow data Monday: Friday and the weekend do not provide ETF data — Monday's opening will reveal whether institutional investors continue selling or stabilize
- Jason's liquidation price: The 2,281 BTC short position will be liquidated if Bitcoin breaks significantly above $74,238. A short squeeze from there could trigger rapid movement towards $76,000–$78,000. This is a concrete level to monitor
- Options expiry: Quarterly BTC options with significant open interest levels around the $70,000–$75,000 strike could amplify volatility towards month-end
- Geopolitics: Research suggests that “Jason” has historically timed shorts against macro shocks — Hormuz tensions and similar events could act as triggers for further downside pressure
Levels to monitor:
| Level | Significance |
|---|---|
| $74,238 | Jason's entry / short squeeze trigger |
| $72,000 | Short-term support, important to hold |
| $70,000 | Psychological floor |
| $67,500 | Next technical support zone |
| $64,000 | Critical — break opens up for $58K |
Fear & Greed at 11/100 is not automatically a buy signal — it tells you the market is scared, not that the bottom has been reached.
The bottom of this risk-off regime is not confirmed. With $56.89 billion in net ETF inflows since January 2024, structural demand is intact in the long term — but short-term momentum, sentiment, and smart money positioning are all pointing in the same direction.
This article was written using large language models under editorial supervision by Aprex. Content is source-verified and auditable. Read our method →