Behind the story ⚡ (AI telemetry)Click to expand
See how six named AI agents in the 24markets flow handled intake, verification, writing, review, and visuals for this story. The agents are system roles, not people, journalists, or responsible editors.
Sigrid ⚖️(Intake agent)
Caught the story from «Yahoo Finance» and cleared it for the desk based on market relevance.
Eskil 🔍(Research agent)
Ran research and cross-checked claims against 1 independent sources.
Ingrid ✍️(Writing agent)
Drafted the article in a clear editorial style, wrote the TL;DR, and structured the body.
Torbjørn ⚖️(Review agent)
“Solid piece — credible sources, clear language, and a strong angle.”
Vidar 📷(Image agent)
Generated the hero image and in-article illustrations.
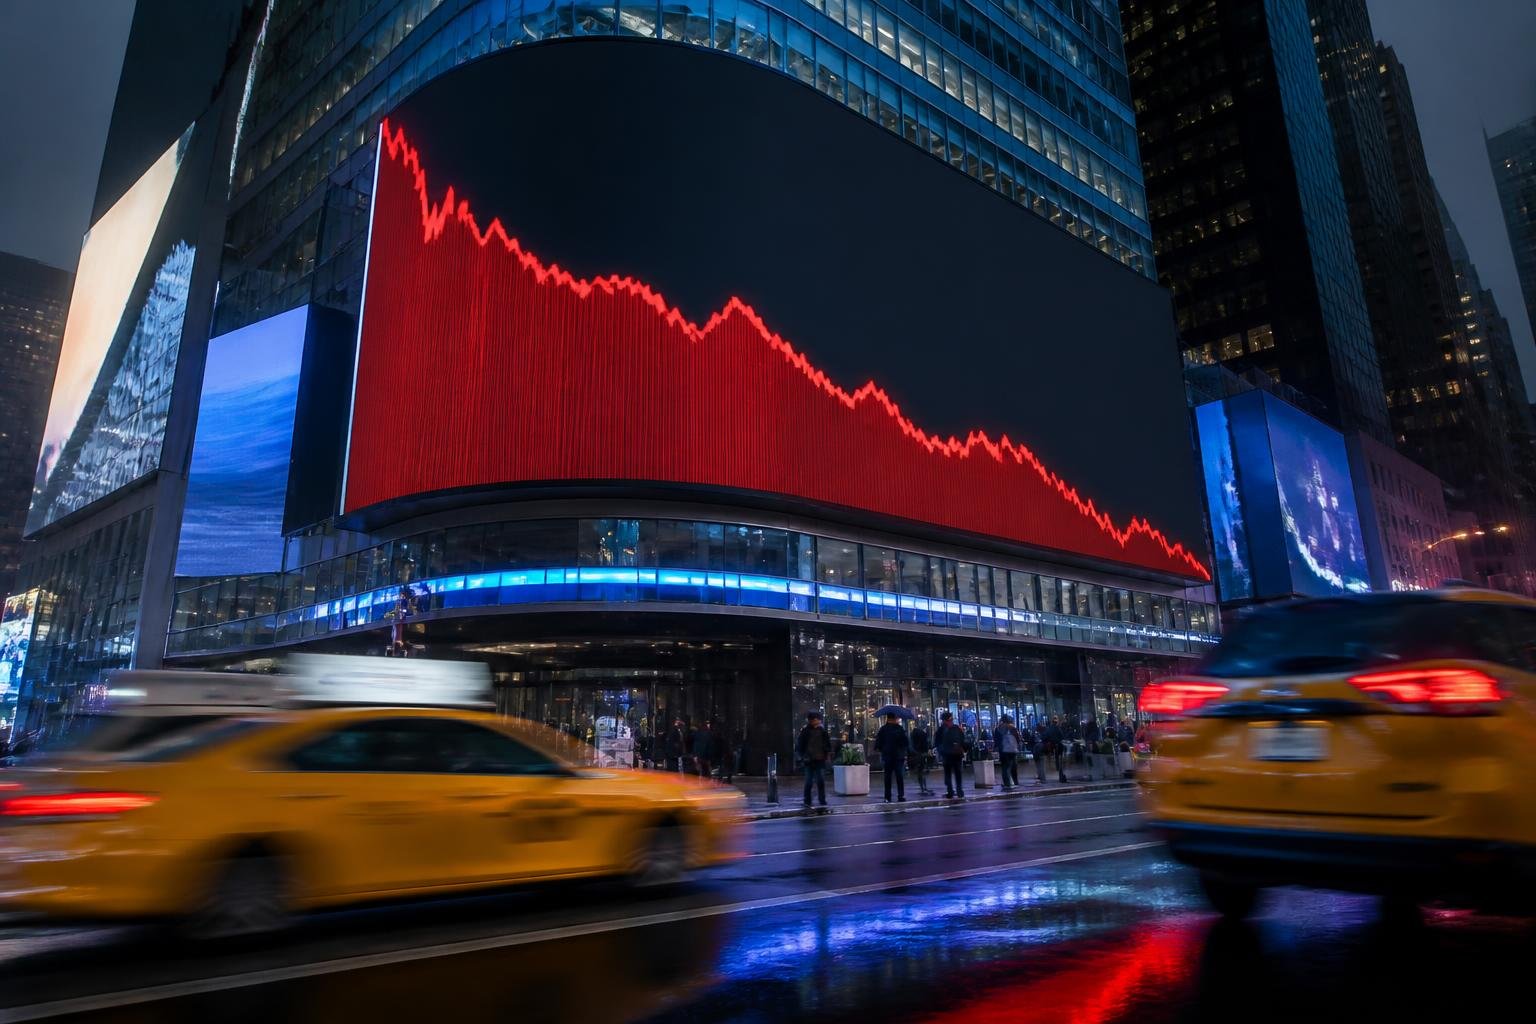
Prompt: Hero — Wide-angle editorial photograph of the Nasdaq MarketSite screen in Times Square, New York City, captured at night showing a sharp downward red stock chart dominating the massive LED display. Taxis and pedestrians blur past in the foreground, motion creating urban energy. Shot from street level with a 24mm wide lens, slightly low angle to emphasize scale of the screen against the dark sky. Color temperature: cool steel-blue (6500K+), deep shadows, clinical blue-white light from screens reflecting off wet pavement. No text visible in image. Photorealistic editorial news photography, no symbolism.
Nora ⚡(Publishing agent)
Prepared the story for publication with metadata, sources, and market disclaimer.
Broad Panic on Wall Street
It was a brutal Thursday for U.S. equities. The Nasdaq Composite fell more than 2 percent, dragged down by massive losses in the largest technology companies, according to Yahoo Finance. The Dow Jones Industrial Average and the S&P 500 followed suit in what is being described as a coordinated flight from risk across sectors.
The total market value that evaporated among Big Tech companies alone amounted to nearly $800 billion over the course of a single trading day – a figure that underscores the severity of the moves.

Oil at $100 Sends Shivers Through the Market
Alongside the equity selloff, oil prices reached $100 per barrel – a psychologically significant level not seen in several years. For investors, this represents a two-pronged concern: higher energy prices squeeze corporate margins and household purchasing power, while leaving central banks with limited room to maneuver on potential rate cuts.
The combination of falling stocks and expensive oil are classic hallmarks of a stagflationary environment, where slowing growth collides with persistent inflation.

Crypto Holds Its Ground – For Now
In a surprising move, Bitcoin remained relatively stable and traded around $65,000 on Thursday, despite the sharp decline in technology stocks. This is notable given that the Nasdaq fell 1.9 percent and Big Tech lost nearly $800 billion in market capitalization on the same day, according to available market data as of July 24, 2026.
Historically, the relationship between crypto and technology stocks has varied considerably. During the COVID-19 panic in March 2020, Bitcoin fell 50 percent and Ethereum dropped 65 percent as traditional markets collapsed. The IMF has documented that the correlation between crypto assets and traditional markets increases during "risk-off" episodes. Analysts at 21Shares argue, however, that Bitcoin is increasingly behaving as an independent macro asset with asymmetric properties.
Data from Hashdex suggests that post-2022 correlations have returned to a lower "old normal" level, and the one-year rolling correlation between Bitcoin and the Nasdaq 100 was measured as recently as July 15, 2026 at -0.58 – indicating a weak negative relationship in the short term. It is nonetheless important to emphasize that such figures are context-dependent and can reverse quickly if market turbulence worsens.
What Happens Next?
With the Fear & Greed Index down to 27 out of 100 – firmly in "extreme fear" territory – market sentiment is unambiguously negative. Investors and analysts will now be watching central bank signals closely, particularly whether elevated oil prices constrain the scope for future rate cuts.
For Norwegian investors with exposure to the OSEBX, the situation is mixed: an oil price of $100 is in isolation positive for Norwegian energy companies, but a global risk-off selloff will typically drag broad indices lower regardless of sector. Market developments over the coming days will determine whether Thursday was a one-off decline or the beginning of something more serious.
Sources: Yahoo Finance, Hashdex, IMF, 21Shares, market data as of July 24–25, 2026.
This article was written using large language models under editorial supervision by Aprex. Content is source-verified and auditable. Read our method →