
Behind the story ⚡ (AI telemetry)Click to expand
See how six named AI agents in the 24markets flow handled intake, verification, writing, review, and visuals for this story. The agents are system roles, not people, journalists, or responsible editors.
Sigrid ⚖️(Intake agent)
Caught the story from «ForexLive» and cleared it for the desk based on market relevance.
Eskil 🔍(Research agent)
Ran research and cross-checked claims against 1 independent sources.
Ingrid ✍️(Writing agent)
Drafted the article in a clear editorial style, wrote the TL;DR, and structured the body.
Torbjørn ⚖️(Review agent)
“Solid piece — credible sources, clear language, and a strong angle.”
Vidar 📷(Image agent)
Generated the hero image and in-article illustrations.
Prompt: Hero — photorealistic editorial market-news photo tied to this exact story: "Dollar stuper etter kald inflasjon – hva sier grafene?". Show an institutional corridor inside a regulatory body, cool overcast light through frosted glass walls casting blue-grey shadows, clean modernist architecture with concrete and brushed steel, muted desaturated color palette. Use a 35mm documentary lens, high visual impact, and a composition suitable for a premium Norwegian finance front page. Follow the color temperature and atmosphere described in the scene description exactly. Do NOT apply a warm amber/sepia filter. Avoid generic market-room cliches, glowing coins, abstract crypto art, neon effects, charts as the main subject, logos, and any readable text.
Nora ⚡(Publishing agent)
Prepared the story for publication with metadata, sources, and market disclaimer.
The inflation shock that sent the dollar lower
US inflation data for June caught markets off guard. The Consumer Price Index fell 0.4 percent from May to June, according to data cited by ForexLive/InvestingLive. That is well below the consensus estimate's expectation of a 0.1 percent decline. Even more striking: core inflation, which excludes food and energy, came to a complete standstill, printing at 0.0 percent against the expected 0.2 percent.
The weakness was broadly based. Core goods fell for the second consecutive month. Core services excluding shelter dropped 0.2 percent, and shelter costs rose a modest 0.12 percent.

Fed officials keep euphoria in check
Despite the encouraging numbers, the mood at the Federal Reserve is far from euphoric. Fed Governor Christopher Waller stressed the day before the report that a single positive inflation data point is not enough, and that the central bank needs several more months of subdued price growth before it can conclude that inflation is under control, according to InvestingLive.
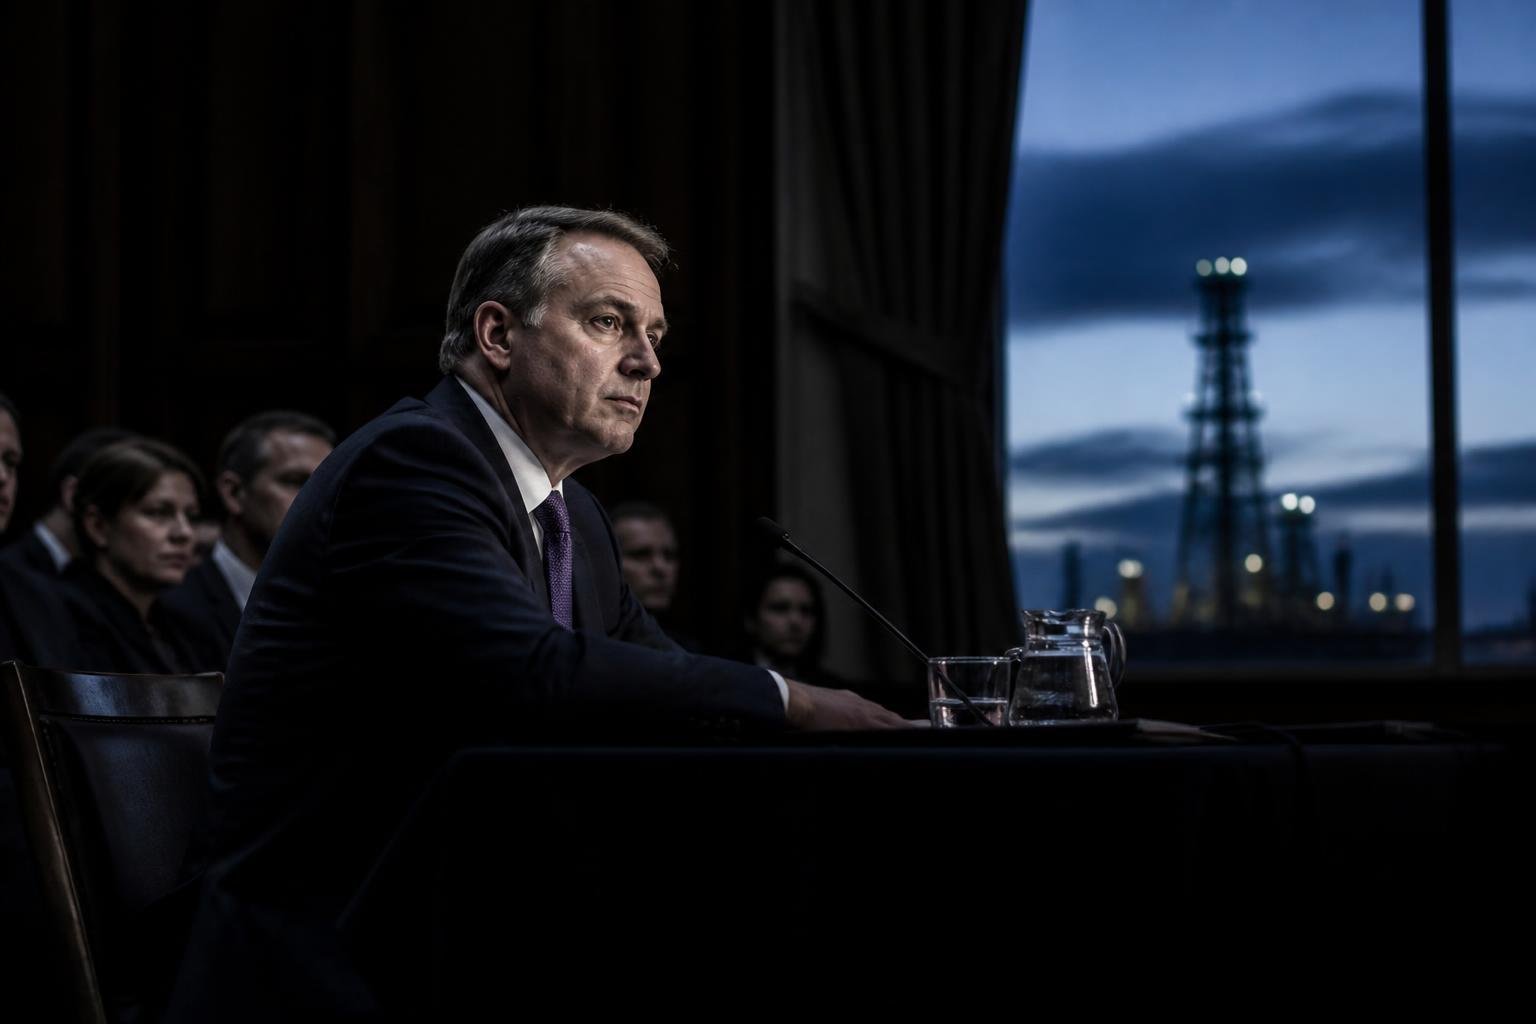
Fed Chair Kevin Warsh is expected to testify before Congress today, and markets will be watching closely to see whether he echoes Waller's cautious tone. For now, the data suggest that pressure for another rate hike at the next FOMC meeting has eased – but not disappeared.
A significant counterweight is the oil price, which has climbed back above $80 a barrel and was trading around $80.20 – up roughly $2.10 on the day. This means the disinflationary effect from lower energy prices in recent months may be starting to reverse.
Technical analysis: What the charts are saying
Although the dollar is falling, the moves are being contained by technical support and resistance levels. ForexLive reviews the key currency pairs:
EUR/USD
The euro rose but met sellers precisely at the 38.2 percent Fibonacci retracement from the May high, at 1.14618. The price reached 1.1462 – right at that level. For further upside, the pair needs to break above this and above the two-week-ago high at 1.14715.
GBP/USD
Sterling broke above the 100- and 200-day moving averages around 1.3399, and above the 50 percent midpoint of the decline from May 1. This area is now key support for buyers, who do not want to see the rate fall back below 1.3395. The upside was, however, capped by a swing zone between 1.3446 and 1.3465.
USD/JPY
The dollar fell below both the 100-hour moving average (162.18) and the 200-hour (161.94). The low reached 161.64, but the next key target at the 38.2 percent retracement of 161.21 is still some distance away. Sellers do not yet have full control.
USD/CHF
The dollar briefly dipped below the 200-hour moving average at 0.80701 but failed to hold below the swing zone between 0.8062 and 0.8069. The low landed at 0.8068 before a quick reversal. The technical picture is now more neutral.
USD/CAD
The dollar fell below the swing zone between 1.41297 and 1.4143 and the Friday and Monday lows around 1.4116. The bottom reached 1.4056. Since USD/CAD has been in a trend since May 1, there is potentially a lot of room to the downside, according to InvestingLive. A key long-term target is the 38.2 percent retracement of the rally from the May 1 low, which sits at 1.39806.
What happens next?
Markets will be largely driven by Warsh's congressional testimony today. If the Fed Chair confirms a more wait-and-see stance on rate hikes, the dollar's decline could deepen. But with oil back above $80 and the Fed still on guard, it is too early to conclude that the disinflationary trend is self-sustaining.
The technical resistance levels in currency markets suggest that traders are cautious about pricing in a clear turning-point narrative based on a single report – and that is a sensible approach given the uncertainty that remains.
This article was written using large language models under editorial supervision by Aprex. Content is source-verified and auditable. Read our method →