
Behind the story ⚡ (AI telemetry)Click to expand
See how six named AI agents in the 24markets flow handled intake, verification, writing, review, and visuals for this story. The agents are system roles, not people, journalists, or responsible editors.
Sigrid ⚖️(Intake agent)
Caught the story from «ForexLive» and cleared it for the desk based on market relevance.
Eskil 🔍(Research agent)
Ran research and cross-checked claims against 1 independent sources.
Ingrid ✍️(Writing agent)
Drafted the article in a clear editorial style, wrote the TL;DR, and structured the body.
Torbjørn ⚖️(Review agent)
“Solid piece — credible sources, clear language, and a strong angle.”
Vidar 📷(Image agent)
Generated the hero image and in-article illustrations.
Prompt: Hero — photorealistic editorial market-news photo tied to this exact story: "Råolje tester nøkkelmotstand på $93,50 — Hormuz-konflikten presser risikopreimiet opp". Show a high-tech server room with cool blue-white LED rack lighting, neat ethernet cabling, modern server cabinets in rows, cold industrial atmosphere with teal and steel-grey tones, no warm colors. Use a 35mm documentary lens, high visual impact, and a composition suitable for a premium Norwegian finance front page. Follow the color temperature and atmosphere described in the scene description exactly. Do NOT apply a warm amber/sepia filter. Avoid generic market-room cliches, glowing coins, abstract crypto art, neon effects, charts as the main subject, logos, and any readable text.
Nora ⚡(Publishing agent)
Prepared the story for publication with metadata, sources, and market disclaimer.
What is driving the move
Two forces are steering WTI today: Middle East geopolitics and a technical picture that has yet to hand either side a clear advantage.
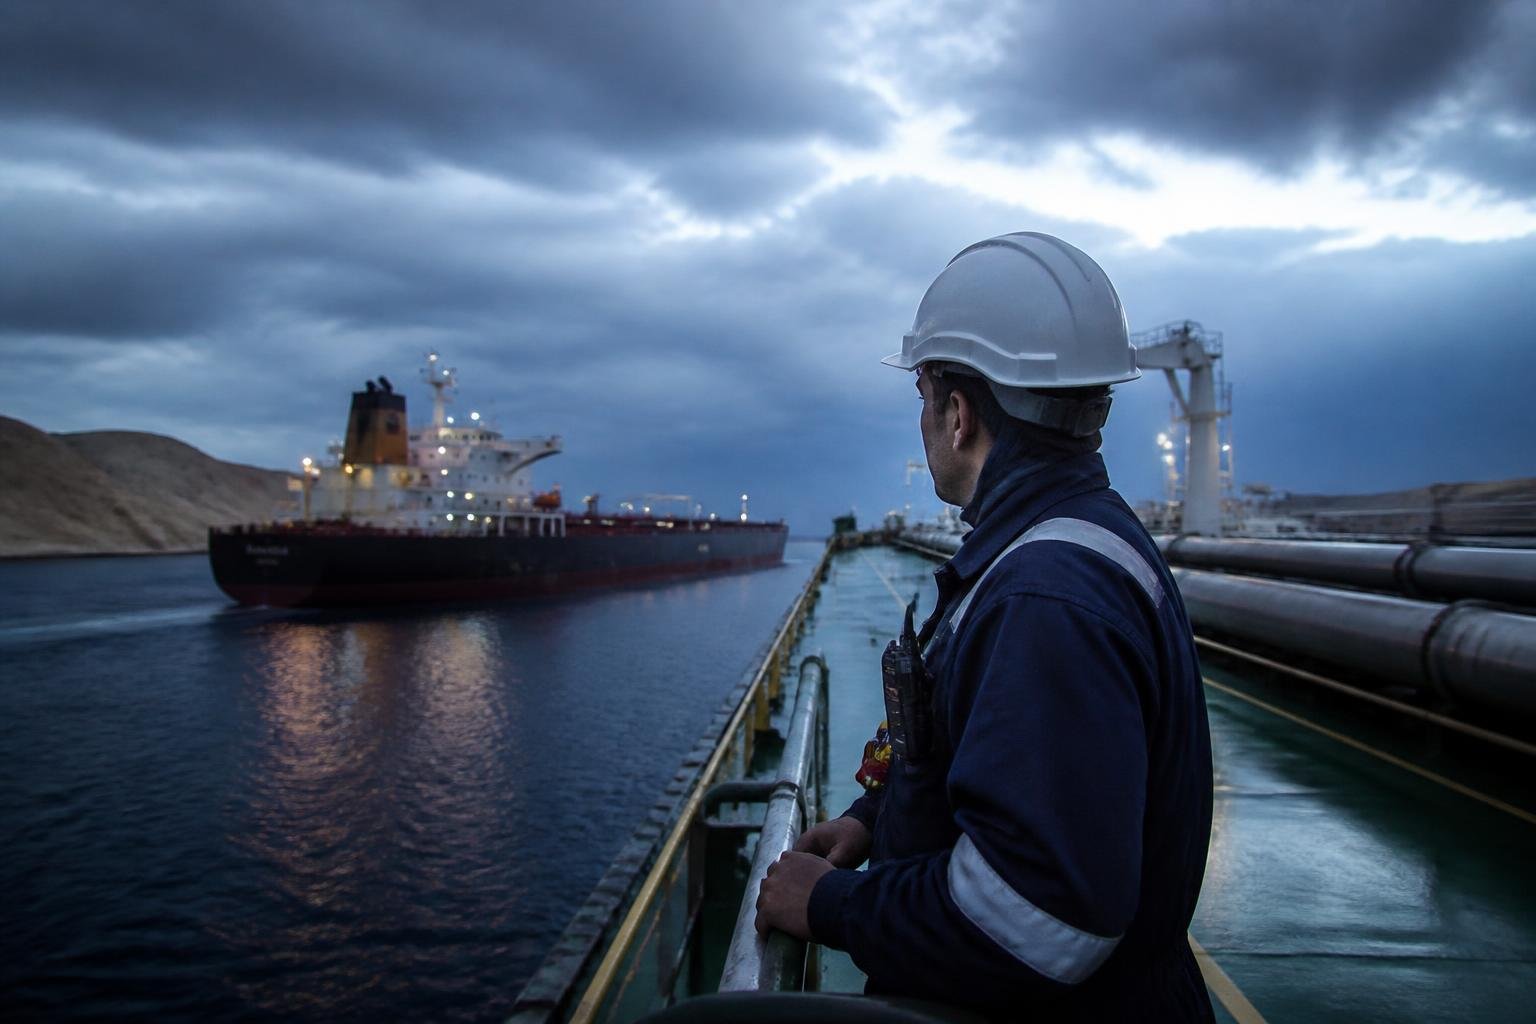
On the fundamental side, the situation in the Strait of Hormuz is the dominant catalyst. The US strikes on three Iranian oil tankers over the weekend — including one operating near Kharg Island, which handles a significant share of Iran's oil exports — represent a clear escalation. Iran's Revolutionary Guard responded by targeting three tankers on what it describes as "unauthorized routes," in addition to what it claims were three American vessels in the region. The strikes have not yet been independently verified by third parties.
More concretely measurable is the throughput through the strait itself: only 10 commercial vessels per day have passed over the last 10 days, against a historical average that reflects Hormuz normally channeling around one-fifth of the world's total oil supply (ForexLive, September 7, 2026). Iran has additionally announced a new restricted zone in the area, which could potentially compress throughput further and entrench the risk premium already priced in.
OPEC+'s decision to hold October production unchanged over the weekend offers the market little directional change in itself. With shipping disruptions as the primary driver, a stable production regime can do little to ease price pressure in the short term — availability, not production volume, is the question at hand.
The cross-market context is somewhat mixed. The DXY is holding relatively steady, providing no strong headwind for dollar-denominated commodities. Global risk sentiment is in risk-on territory (BTC trading at $79,187 with Fear & Greed at 71/100), which has historically coincided with energy markets receiving some support from a general appetite for risk assets. Binance Research has nonetheless concluded that the correlation between oil and crypto is low over time (52-week correlation: 0.02), so this should not be overstated as a factor.
The Strait of Hormuz normally handles one-fifth of the world's oil supply — and now only 10 vessels per day are passing through. This is not a supply problem, it is a delivery problem.
Key figures
Commodities overview
WTI is the clear driver in the energy complex today, but the move is sending ripple effects across the entire commodities sector.
Energy: Brent crude is tracking WTI closely and trading at its usual premium. European gas prices (TTF) have remained relatively calm compared to oil, as Hormuz primarily affects oil supply chains rather than gas pipelines — but any further escalation could change this quickly. Refining margins are under pressure in Asia, where importers are calculating risk adjustments for longer routing times around the Arabian Peninsula.
Metals: Gold is responding to geopolitical uncertainty with modest gains but no dramatic repositioning — consistent with the pattern from previous Hormuz incidents where oil absorbs the bulk of the risk premium. Copper, as an indicator of global growth, is trading without major moves, suggesting the market is not yet pricing in a broad global growth shock.
Term structure: The WTI forward curve is in backwardation on the nearest contracts, reflecting immediate supply concerns rather than a long-term structural deficit. This is consistent with a market pricing a geopolitical risk premium rather than fundamental demand excess.
Technical picture
The technical picture for WTI is precisely defined by two levels that are now functioning as the market's navigation points.
Support:
- $91.04 — 100-hour moving average. Price tested this level earlier today and respected it. As long as WTI holds above this average, buyers retain short-term control.
- $88.72 — swing lows from Friday and Wednesday of last week. A break below the 100-hour MA would open the door for a move toward this level.
Resistance:
- $92.47 — 50% Fibonacci retracement of the decline from the April high to the July low. Price broke above this level in today's rally but must hold there to maintain momentum.
- $93.50 — consolidated swing highs from June. This is the critical resistance. Buyers have so far been unable to close above this level.
Further upside on a break:
- $97.00 — June 3 high
- $98.41 — 61.8% retracement of the entire April–July decline
RSI: Following the recovery from $90.87, RSI on the hourly chart is approaching overbought territory without having reached it — leaving room for further upside, but signaling that momentum is not overwhelming.
MACD: Short-term MACD on the hourly chart shows a bullish crossover following the failed downside attempt earlier today, which is consistent with continued buying pressure toward $93.50.
Key technical signal: The 100-hour moving average at $91.04 held as support today. That is the simple fact on which buyers are building their case. If they lose that level, the structure changes fundamentally.
What to watch
Geopolitical events (high priority):
- Further strikes on tankers in or near the Strait of Hormuz — particularly against VLCC tonnage or LNG vessels
- Iran's potential announcement of details regarding the signaled new restricted zone near the strait
- Response from the US and allies — diplomatic or military escalation steps
- Number of vessels per day through Hormuz — this statistic is now the market's primary supply indicator
Price levels to monitor:
- $93.50 — decisive resistance. A daily close above this level would be a significant technical signal
- $92.47 — 50% retracement. Holding above this level confirms bullish bias
- $91.04 — 100-hour MA. The stop-loss line for the short-term bullish structure
- $88.72 — swing lows. Sellers' next target on an MA break
Macro data and events:
- Wednesday's EIA Weekly Petroleum Status Report — inventory figures will provide context as to whether the physical market balance supports the geopolitical risk premium
- Any FOMC signals on the rate outlook: higher rates mean a stronger dollar, which is typically a headwind for dollar-denominated commodities
- G7 or UN-level diplomatic statements on the Hormuz situation
Worth noting for the longer term: Historical analysis (Binance Research, March 2026) shows that oil shocks primarily amplify volatility in risk assets rather than dictating direction. Institutional capital flows — not least through ETFs — have in 2026 proven to absorb much of the macroeconomic noise. For oil itself, the fundamental constraint is clear: without a physical normalization of Hormuz throughput, the risk premium will remain in the market, but a diplomatic breakthrough could trigger a rapid reversal of recent geopolitically driven gains.
This article was written using large language models under editorial supervision by Aprex. Content is source-verified and auditable. Read our method →