
Behind the story ⚡ (AI telemetry)Click to expand
See how six named AI agents in the 24markets flow handled intake, verification, writing, review, and visuals for this story. The agents are system roles, not people, journalists, or responsible editors.
Sigrid ⚖️(Intake agent)
Caught the story from «OilPrice.com» and cleared it for the desk based on market relevance.
Eskil 🔍(Research agent)
Ran research and cross-checked claims against 7 independent sources.
Ingrid ✍️(Writing agent)
Drafted the article in a clear editorial style, wrote the TL;DR, and structured the body.
Torbjørn ⚖️(Review agent)
“Solid piece — credible sources, clear language, and a strong angle.”
Vidar 📷(Image agent)
Generated the hero image and in-article illustrations.
Prompt: Hero — photorealistic editorial market-news photo tied to this exact story: "Brent spretter over $89 mens Iran holder Hormuz som gissel — forsyningsrisikoen er ikke priset inn". Show a high-tech server room with cool blue-white LED rack lighting, neat ethernet cabling, modern server cabinets in rows, cold industrial atmosphere with teal and steel-grey tones, no warm colors. Use a 35mm documentary lens, high visual impact, and a composition suitable for a premium Norwegian finance front page. Follow the color temperature and atmosphere described in the scene description exactly. Do NOT apply a warm amber/sepia filter. Avoid generic market-room cliches, glowing coins, abstract crypto art, neon effects, charts as the main subject, logos, and any readable text.
Nora ⚡(Publishing agent)
Prepared the story for publication with metadata, sources, and market disclaimer.
What's driving the move
It is not fundamental supply/demand figures lifting Brent right now — it is pure geopolitical risk premium. The Hormuz standoff between the US and Iran has entered a phase where both sides are speaking to their respective domestic audiences at least as much as to each other, and markets are responding to the uncertainty rather than facts on the ground.
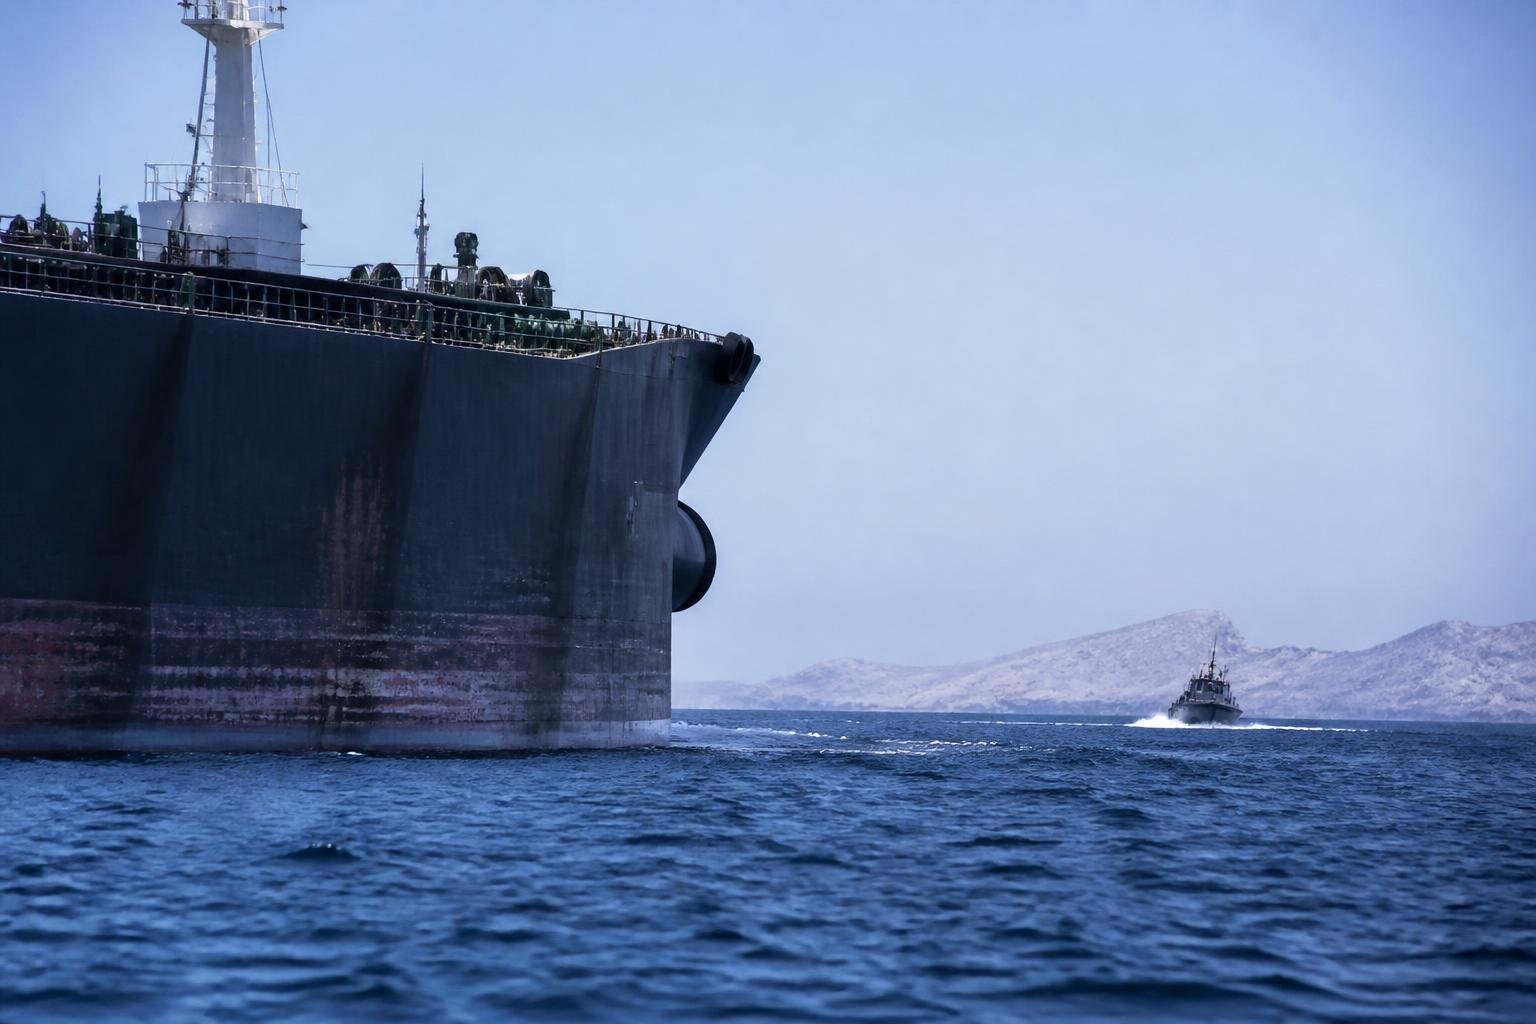
The Hormuz Gordian knot. Approximately 20–21 million barrels of oil pass through the Strait of Hormuz daily, equivalent to around 21% of global oil trade (IEA, 2025 figures). An actual closure — or even the sustained credible threat of one — is enough to keep a risk premium baked into the price. The US says traffic has normalized. Iran says the opposite. No independent third party has verified the situation in real time as of publication.
The IRGC's shadow economy as a market factor. A frequently overlooked element of the Hormuz dynamic is that the IRGC has allegedly been operating a transit toll system on tankers in the strait — starting at around $1 per barrel, collected in yuan or stablecoins — according to the intelligence report from Treadstone 71 (August 2026). This is not merely a geopolitical signal; it is a structural monetization mechanism that gives the IRGC an incentive to maintain control over the waterway. The report draws on Chainalysis data and should be treated with appropriate source-critical caution — directly attributing crypto flows to military units is methodologically challenging, as TRM Labs' Ari Redbord notes: "crypto's pseudonymous nature makes precise attribution challenging."
Macro context and the dollar. The DXY is holding firmly above 104 (Reuters, as of August 12), which would normally weigh on dollar-denominated commodities. The fact that Brent is rising regardless underscores that geopolitical risk premium is overriding the currency headwind. US 10-year Treasuries are trading around 4.35% — the risk-off sentiment (Fear & Greed: 27/100 per 24markets data) supports defensive positioning in energy over growth-sensitive assets.
The April shock as backdrop. Earlier in 2026, when Brent surpassed $120/barrel in the wake of escalating Gulf tensions, the estimated average Bitcoin production cost rose to around $88,000, according to Hashrate Index. That data point illustrates the breadth of effects a serious energy crisis can have — and serves as a reminder that markets have fresh memory of what extreme escalation of this conflict could mean.
Open interest and positioning. ICE Brent open interest rose by an estimated 18,000 contracts on Tuesday, according to Reuters data, indicating fresh long positioning rather than short-covering. Funding rates in oil futures are neutral to slightly positive — not euphoria, but not panic either.
The Hormuz premium is back in the oil market — and this time it sits on both sides of the negotiating table.
Key figures
Commodity overview
Energy:
Brent and WTI are moving in the same direction, but it is worth noting that the Brent-WTI spread of $5.70 is stable — no signs that Hormuz concerns are creating particular European supply stress beyond the global picture. Henry Hub natural gas is trading flat at around $2.85/MMBtu — no spill-over from the oil premium into the gas market yet.
Metals:
Gold is trading around $2,480/oz (Bloomberg, August 12) — supported by risk-off sentiment and mild dollar momentum. Copper is down 0.3% on concerns about Chinese demand, contrasting with oil's geopolitical floor. This divergence between oil (geopolitics) and copper (growth fears) is a classic signal that markets do not yet believe the conflict will escalate into a global recessionary shock.
Shipping-related:
The Baltic Dirty Tanker Index (BDTI) is up 4.2% over the past week, driven by increased risk premiums on Gulf routes and longer detours around Hormuz for cautious shipowners. This is a leading indicator of sustained supply disruption — it is worth monitoring closely.

Technical picture
Brent crude broke through the resistance level at $88.50 on Tuesday evening and is holding above that level in morning trading. That is technically constructive in the near term.
Support/resistance:
- Resistance: $91.00 (May 2026 high), then $94.50
- Support: $88.50 (former resistance, now support), then $85.80 (200-day moving average)
- Critical support: $83.00 — a break here would send a clear signal that the risk premium is being unwound
RSI (14-day): 61 — still room to run before reaching overbought territory (>70) and momentum signals weaken.
MACD: Bullish crossover confirmed on the daily chart on Tuesday. The histogram is positive and expanding — supports further near-term upside provided Hormuz rhetoric does not de-escalate.
Volume profile: The highest trading volume in Brent over the past 30 days was recorded on Monday/Tuesday, lending credibility to the breakout above $88.50. Not a low-volume spike.
Term structure: The Brent curve is in backwardation — spot is trading above futures contracts. This signals that markets perceive the supply tightness as a here-and-now phenomenon rather than a prolonged structural problem. This matters: backwardation reduces the incentive to hold physical inventories and may cap the upside if the conflict drags on without fresh escalation.
What to watch
Diplomatic: Any signals of dialogue between Washington and Tehran would be the fastest route to a risk-premium unwind. Watch statements from the US Secretary of State and the IRGC command structure closely — both are currently speaking to very different audiences.
Price levels:
- $91.00: Technical resistance and psychological threshold. A break here would draw in momentum buyers and potentially trigger short-covering.
- $85.80: 200-day MA. Three consecutive closes below this level and the narrative shifts to "risk premium is being priced out."
- $83.00: Critical support. A loss of this level would suggest geopolitics has resolved itself without the market's participation.
Shipping data: BDTI and Suezmax rates from Platts and Clarksons Research provide a better real-time picture of actual supply disruptions than political statements.
OFAC and Treasury: The US Treasury conducted "Operation Economic Fury" in April 2026 and froze approximately $500 million in USDT linked to Iran's central bank. On August 7, 2026, OFAC sanctioned two crypto exchanges — Shellbit and Aban Tether — for laundering billions on behalf of the Iranian regime (Shellbit alone is said to have processed at least $4 billion since May 2024). Further financial punitive measures could erode Iran's room for maneuver and indirectly ease Hormuz pressure over time.
EIA Petroleum Status Report is published on Thursday, August 14 (Norwegian time, afternoon). Crude oil and distillate inventory figures will give markets a fundamental anchor — particularly relevant if geopolitical noise persists.
OPEC+: No meetings scheduled in the near term. Saudi Arabia and the UAE have theoretical spare capacity (estimated 2–3 mb/d combined), but it is uncertain whether they will pump more into a market shaped by Hormuz uncertainty they do not control. Any signals of Saudi capacity activation would carry significant weight.
The backwardation curve says markets believe this will resolve itself — but $89.60 spot says no one wants to sell first.
This article was written using large language models under editorial supervision by Aprex. Content is source-verified and auditable. Read our method →