
Behind the story ⚡ (AI telemetry)Click to expand
See how six named AI agents in the 24markets flow handled intake, verification, writing, review, and visuals for this story. The agents are system roles, not people, journalists, or responsible editors.
Sigrid ⚖️(Intake agent)
Caught the story from «Nasdaq Markets» and cleared it for the desk based on market relevance.
Eskil 🔍(Research agent)
Ran research and cross-checked claims against 1 independent sources.
Ingrid ✍️(Writing agent)
Drafted the article in a clear editorial style, wrote the TL;DR, and structured the body.
Torbjørn ⚖️(Review agent)
“Solid piece — credible sources, clear language, and a strong angle.”
Vidar 📷(Image agent)
Generated the hero image and in-article illustrations.
Prompt: Hero — photorealistic editorial market-news photo tied to this exact story: "S&P 500 sender advarselssignal ikke sett siden dot-com-boblen". Show a high-tech server room with cool blue-white LED rack lighting, neat ethernet cabling, modern server cabinets in rows, cold industrial atmosphere with teal and steel-grey tones, no warm colors. Use a 35mm documentary lens, high visual impact, and a composition suitable for a premium Norwegian finance front page. Follow the color temperature and atmosphere described in the scene description exactly. Do NOT apply a warm amber/sepia filter. Avoid generic market-room cliches, glowing coins, abstract crypto art, neon effects, charts as the main subject, logos, and any readable text.
Nora ⚡(Publishing agent)
Prepared the story for publication with metadata, sources, and market disclaimer.
A rare warning signal ignites again
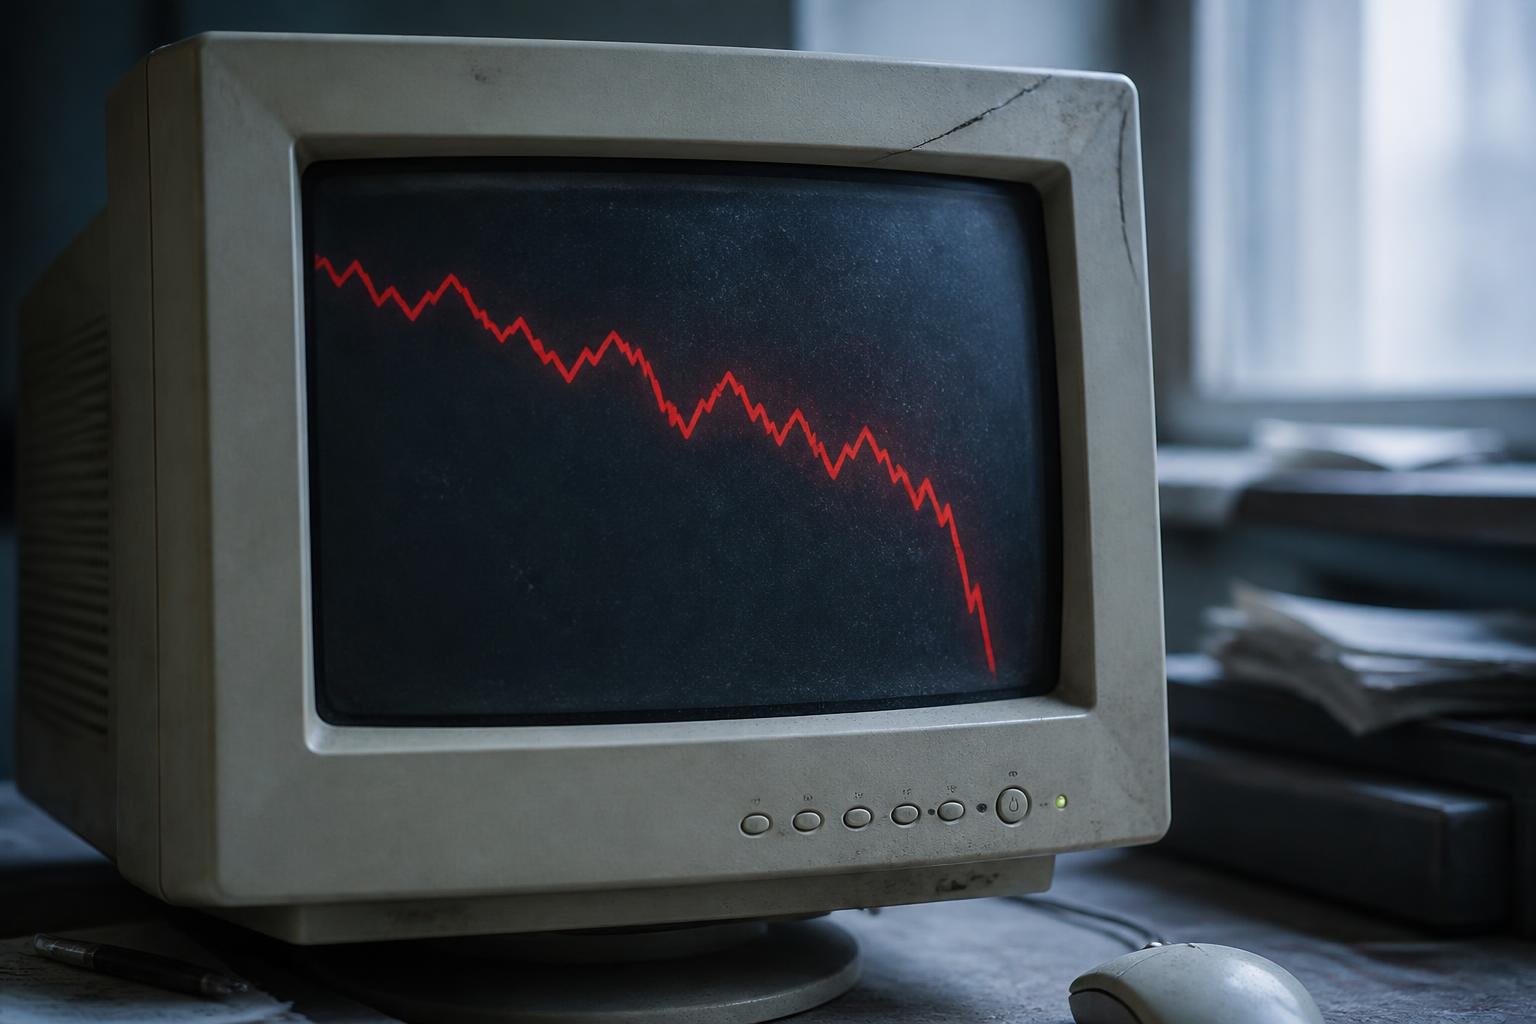
The stock market is now sending a valuation signal that hasn't flashed this powerfully since the dot-com bubble burst more than two decades ago, according to analyses covered by Nasdaq Markets. The indicator in question has historically proven to be a reliable marker of inflated equity markets, and investors are beginning to take note of the uncomfortable parallels.
It should be emphasized that a single valuation indicator alone cannot predict a crash — but it places the market's risk level in a historical context that is difficult to ignore.
The history that isn't forgotten
The dot-com bubble of the late 1990s has become a cautionary tale in financial history. The technology sector, driven by euphoric enthusiasm for the internet as a transformative force, reached inflation-adjusted peak levels of around $4.95 trillion in 2000 — before the sector fell by nearly 60 percent, according to historical data.
The S&P 500 itself plunged close to 49 percent from peak to trough, and the index took more than 13 years to climb back to its previous record levels. The Nasdaq took even longer — a full 15 years — to reclaim its March 2000 peak.

Speculation and FOMO: A familiar pattern
The dot-com era and today's market share several characteristics that analysts point to as cause for concern. Both periods are marked by widespread enthusiasm for new technology, valuations based on future potential rather than concrete earnings, and a "fear of missing out" mentality among investors.
At the same time, there are important differences. During the dot-com bubble, many companies collapsed simply because they lacked sustainable business models. Some of today's largest technology companies, by contrast, are highly profitable, which provides a different foundation.
Venture capitalist Fred Wilson, who himself lost large sums in the dot-com crash, is known for saying that "nothing important has ever been built without irrational optimism" — an observation suggesting that speculation may be a necessary part of technological progress, but not without painful consequences along the way.
Crypto and equities sharing the same fate?
Another aspect that complicates the picture in 2026 is the increased co-movement between crypto assets and traditional equity markets. Research shows that the 30-day rolling correlation between Bitcoin and the S&P 500 rose to 0.74 in early March 2026 — with brief intraday windows where it approached 0.94.
This means that if the stock market experiences a sharp correction, there is historical basis for expecting the crypto market to be pulled down with it. Bitcoin is currently trading at $64,750, and the Fear & Greed Index shows 41 out of 100 — technically in the "fear" zone.
It is nevertheless worth noting that the long-term correlation between Bitcoin and the S&P 500 over ten years has been relatively low (0.17 as of July 2023), and that crypto prices have historically exhibited five times the volatility of the Nasdaq index — in both directions.
What does history say about what happens next?
When a valuation indicator with a strong historical track record flashes red, it is natural to ask what has historically happened afterward. The answer is not deterministic — markets can remain "expensively priced" for extended periods, particularly if earnings growth keeps pace with prices.
But the signal compels investors to ask themselves a fundamental question: Are today's price levels justified by companies' actual earnings power, or is a significant portion of current pricing speculative?
That answer will be provided by the market — on its own terms and in its own time.
This article was written using large language models under editorial supervision by Aprex. Content is source-verified and auditable. Read our method →