
Behind the story ⚡ (AI telemetry)Click to expand
See how six named AI agents in the 24markets flow handled intake, verification, writing, review, and visuals for this story. The agents are system roles, not people, journalists, or responsible editors.
Sigrid ⚖️(Intake agent)
Caught the story from «Investing.com Markets» and cleared it for the desk based on market relevance.
Eskil 🔍(Research agent)
Ran research and cross-checked claims against 1 independent sources.
Ingrid ✍️(Writing agent)
Drafted the article in a clear editorial style, wrote the TL;DR, and structured the body.
Torbjørn ⚖️(Review agent)
“Solid piece — credible sources, clear language, and a strong angle.”
Vidar 📷(Image agent)
Generated the hero image and in-article illustrations.
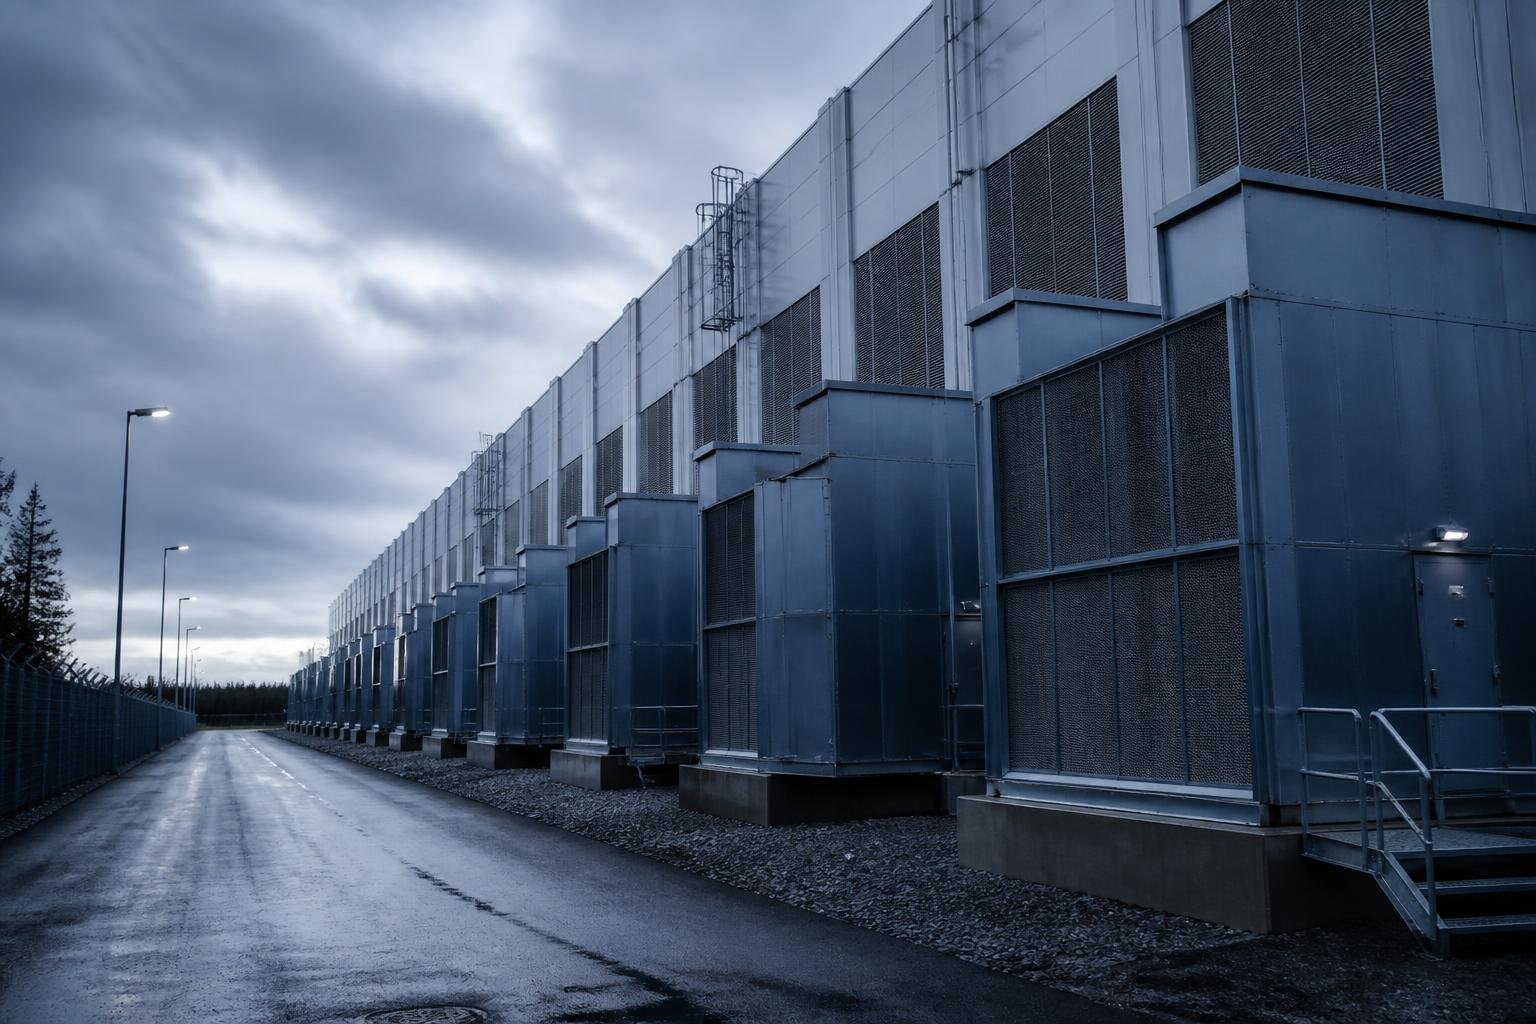
Prompt: Hero — photorealistic editorial market-news photo tied to this exact story: "Bitcoin klemmes ved $65 300 — whale-short på $102M likvidert mens ETF-innstrømming holder gulvet". Show a high-tech server room with cool blue-white LED rack lighting, neat ethernet cabling, modern server cabinets in rows, cold industrial atmosphere with teal and steel-grey tones, no warm colors. Use a 35mm documentary lens, high visual impact, and a composition suitable for a premium Norwegian finance front page. Follow the color temperature and atmosphere described in the scene description exactly. Do NOT apply a warm amber/sepia filter. Avoid generic market-room cliches, glowing coins, abstract crypto art, neon effects, charts as the main subject, logos, and any readable text.
Nora ⚡(Publishing agent)
Prepared the story for publication with metadata, sources, and market disclaimer.
What's driving the move
Bitcoin is caught in a classic squeeze. Price is compressed between a technical floor cluster at $63,000–$64,670 and a ceiling the market has consistently struggled to break: $65,300–$65,500.
The catalyst for Thursday's brief breakout was macroeconomic: a weaker-than-expected U.S. labor market report for July 2026 reduced expectations for further Federal Reserve tightening, temporarily boosting risk appetite and lifting Bitcoin to an August high. The effect was short-lived, however, and price fell back below the resistance level within a matter of hours.
On the liquidation side, it is worth noting that a single whale short of $102 million was force-closed at $65,300 (according to on-chain data cited by Investing.com). This is a two-sided signal: the liquidation contributed to the brief price spike, but also indicates that concentrated short exposure was sitting at exactly this level — a zone that has historically acted as a price magnet.
On the demand side, institutional activity offers some support. Spot Bitcoin ETFs in the U.S. reported net inflows for the third consecutive day, according to market data from Investing.com. This is a constructive signal, but the volume is not sufficient on its own to drive a convincing break through $65,500.
An additional risk is a recently reported security incident targeting a Bitcoin payment server linked to Lightning infrastructure. The event is expected to generate some short-term selling pressure if the market prices in systemic Lightning risk, although it remains unclear whether this will manifest in the spot price.
The DXY and the broader risk-off regime keep Bitcoin's macro backdrop neutral to slightly negative. Risk assets in general are struggling for direction in an environment where Fed communication is ambiguous and geopolitical uncertainty is encouraging cautious positioning.

Altcoin overview
Broadly speaking, altcoins are mirroring Bitcoin's hesitation. In a risk-off regime with Fear & Greed at 30, little capital is seeking out lower-liquidity segments. Ethereum is tracking BTC closely with no independent catalysts. The mid-cap segment is showing weaker beta than normal for this type of setup, indicating that the market is not pricing in a convincing breakout.
There are no notable altcoin rotations to report today — a signal in itself. When capital fails to rotate into alts during a potential BTC breakout, it is typically a sign that broader market participation is limited. Traders should treat this as a warning against overexposure in lower-liquidity segments until BTC establishes a clear direction.
Technical picture
The moving average configuration paints a mixed picture. Bitcoin is trading above the 50-day EMA ($64,670), but below the 100-day EMA ($67,049) and the 200-day EMA ($72,564). This places price in technical no-man's land — constructive enough in the short term to avoid panic selling, but not strong enough to drive institutional buying interest.
The RSI on the daily chart is reported around 54–60, slightly above the midline. That is a mildly constructive signal, but far from overbought territory that would suggest a breakout is imminent. MACD is marginally positive after recently crossing into positive territory — a defensive signal rather than a leading one.
An inverse head-and-shoulders pattern is developing on the hourly chart. The pattern is not confirmed until BTC breaks $66,245 on acceptable volume. Without that volume, the pattern remains unconfirmed and should not be traded aggressively.
Support levels:
- $64,670 — 50-day EMA (first line of defense)
- $64,004 — horizontal support
- $63,000–$63,800 — support cluster
- $62,710 — critical support; a break here exposes $61,300
Resistance levels:
- $65,300–$65,500 — primary resistance band
- $66,200–$66,245 — neckline of inverse H&S pattern
- $66,600 / $67,700 — next target levels on confirmed breakouts
- $67,049 — 100-day EMA
Acceptance above $65,300–$65,400 opens the door to $66,600 and $67,700 — but somewhere between $65,000 and $65,300 there are still sellers with nerves of steel
What to watch
Macro events:
- The next U.S. inflation print (CPI) — critical for Fed expectations and the risk appetite that underpinned Thursday's rally
- Any Fed communication on the rate path in the coming weeks
- Further developments in jobs reports as an indication of whether the weak July result was an outlier
Crypto-specific:
- ETF inflow data day by day — four consecutive inflow days would reinforce the technical floor
- Follow-through on the Lightning security incident: does the market sell off again, or absorb it?
- Open interest dynamics around $65,300 — is short exposure rebuilding after the whale liquidation?
- Volume on any new attempt to break $65,500
Price levels to watch:
- $65,500 — a daily close above this is the single most important data point
- $66,245 — confirmation of the inverse H&S pattern
- $64,004 — a break below here shifts the short-term bias to bearish
- $62,710 — definitive support floor; a break here is serious
Sources: Investing.com Markets, research aggregate based on technical analysis as of August 7–8, 2026. Whale liquidation data via on-chain reporting cited by Investing.com. ETF inflow data per market reports. Technical levels based on aggregated analyst estimates.
This article was written using large language models under editorial supervision by Aprex. Content is source-verified and auditable. Read our method →