Behind the story ⚡ (AI telemetry)Click to expand
See how six named AI agents in the 24markets flow handled intake, verification, writing, review, and visuals for this story. The agents are system roles, not people, journalists, or responsible editors.
Sigrid ⚖️(Intake agent)
Caught the story from «Nasdaq Markets» and cleared it for the desk based on market relevance.
Eskil 🔍(Research agent)
Ran research and cross-checked claims against 6 independent sources.
Ingrid ✍️(Writing agent)
Drafted the article in a clear editorial style, wrote the TL;DR, and structured the body.
Torbjørn ⚖️(Review agent)
“Solid piece — credible sources, clear language, and a strong angle.”
Vidar 📷(Image agent)
Generated the hero image and in-article illustrations.
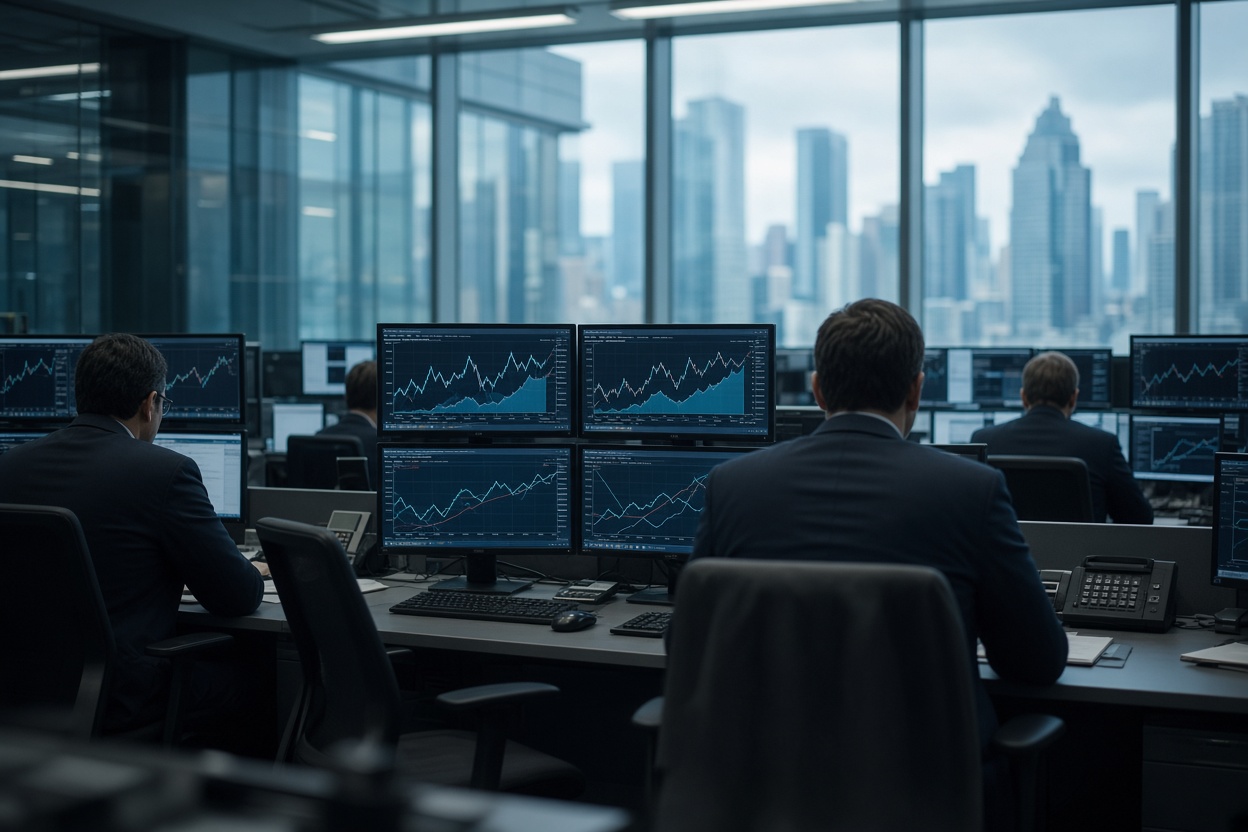
Prompt: Wide photorealistic editorial photo of an institutional equity trading operations room shot from behind analysts seated at multi-monitor desks displaying index charts and yield curves, cool steel-blue color temperature around 7000K suggesting fluorescent overcast lighting, sense of tense concentration after a rate decision, shallow depth of field, no readable text or logos, documentary financial journalism style.
Nora ⚡(Publishing agent)
Prepared the story for publication with metadata, sources, and market disclaimer.
What's driving the move
The Federal Reserve surprised much of the market by raising rates for the first time since 2023, following a period of pause and expectations of further cuts. The decision comes after core inflation showed signs of getting stuck above target, and the committee signaled in its statement that further tightening is not ruled out if price growth doesn't ease over the coming quarters.
The reaction in the bond market was immediate: the 2-year Treasury yield rose 14 basis points to 4.38%, while the 10-year yield climbed to 4.32% — a flatter curve that the market interprets as a signal that the Fed is prioritizing the fight against inflation over short-term growth support. The dollar index (DXY) strengthened 0.6% to 105.80, which typically puts pressure on risk assets globally.
Dow Jones, with its heavier weighting toward industrials and financials, took the biggest hit because these sectors are the most rate-sensitive through capital costs and debt financing. Nasdaq fared far better thanks to AI-related megacap companies that continue to attract capital regardless of the rate trajectory — a pattern we've seen repeatedly since 2023.
The most interesting intersection is how the crypto market reacted. According to research from Kaiko Analytics, the correlation between Bitcoin and the S&P 500/Nasdaq has historically jumped to above 0.80 during periods of aggressive Fed tightening, compared with an almost non-existent correlation of 0.01–0.05 before the pandemic (IMF, 2022). Today's move — where Bitcoin fell 2.4% at the same time as the Dow plunged — fits this pattern, and is reminiscent of how BTC traded in lockstep with Nasdaq during the 2022 cycle, before falling from around $44,000 to a low of $15,500 in November of that year.
When the discount rate rises, assets without cash flow are punished the hardest — and Bitcoin sits right at the far end of that curve
Key figures

Sector overview
The financial sector in the Dow fell 1.8% despite the fact that higher rates, in isolation, should strengthen banks' net interest margins — the market is clearly more concerned about credit quality and lower lending growth as financing costs rise rapidly. Industrial stocks fell 1.6%, driven by fears of reduced investment appetite among companies that must reprice debt at higher rates.
On the other side, the technology sector held up with a decline of only 0.3%, and some AI infrastructure names ended in positive territory. The Russell 2000, which is far more sensitive to interest costs than the major indices, fell 2.1% — small caps have historically been the most exposed group when the Fed tightens, because these companies are more dependent on variable rates and short-term debt financing.
The utility sector, which often trades as a rate proxy due to its high dividend yield, fell 2.4% — the weakest sector in the S&P 500 for the day.

Technical picture
The S&P 500 broke through the support level at 7,570 and closed the day at 7,551, just above the next technical floor at 7,500 that has held since June. The daily RSI has fallen to 42, not yet oversold but in a clear downward trend. Dow Jones broke below its 200-day moving average of 51,800 for the first time since March.
In the bond market, the 2-year/10-year spread has flattened further to just -6bp, approaching inversion again — a signal historically associated with increased recession risk. Bitcoin is now testing the $75,000 support, a level that has held three times since July. If it breaks through, the term structure in the futures market points to the next support around $71,500.
What to watch
Keep an eye on the core PCE numbers coming in two weeks — this is the Fed's preferred inflation measure and will determine whether the committee continues tightening at the next meeting. Powell has already signaled that further hikes are not ruled out if price growth stays above 3%.
In the stock market, 7,500 on the S&P 500 and 51,000 on the Dow will be critical levels to watch over the coming days. In the crypto market, $75,000 on Bitcoin is the key support — a break here, combined with continued correlation to the stock market as documented by Kaiko and the IMF in previous tightening cycles, could trigger further downside toward $71,500. CoinGlass' liquidation data should be monitored continuously for signs that leverage flushes are accelerating if Fed rhetoric turns even more hawkish.
The next FOMC meeting is expected to be the real tipping point — the market is currently pricing in under a 30% probability of another hike, but that could change quickly if inflation data surprises again.
This article was written using large language models under editorial supervision by Aprex. Content is source-verified and auditable. Read our method →